Unity Shader benchmarking with ARM Mali Offline Compiler
- Abhishek Jathan
- Oct 3, 2025
- 6 min read

This started with me trying to benchmark shaders for URP. One of the proper tools for digging into shaders is RenderDoc. It’s great and shows you everything happening in a frame at runtime, but for me it felt like too much detail when all I wanted was a quick check on performance before and after optimisation.
The key here is quick comparison. As a beginner, going through all the info in RenderDoc can take time, while this method turned out to be faster for getting an overall idea of how heavy a shader is.
Here’s a quick comparison of the tools I’ve been using:
Unity Frame Debugger: Lets you step through each draw call in your scene and see how shaders, materials, and objects are being rendered. Quick and easy for beginners to spot issues or see what’s happening.
RenderDoc: Great for inspecting what happens in a frame at runtime. Gives lots of details, but as a beginner it can take time to find what you need. (Mainly a frame debugger, not a benchmarking tool.)
ARM Mali Offline Compiler: Fast for quick shader comparisons before and after optimisation. Gives simple, condensed stats about shader cost, perfect for getting an overall idea without the overhead.
ARM Studio comes with an offline shader compiler for Mali GPUs, and that gives back simple and condensed stats. Perfect for quick insights without the overhead.
This post is basically about how I use Mali Offline Compiler to check my shaders before and after optimisation.
Step 1: Export shader
Select your shader in the project window. On selection there will be a button to "Compile and show code" in the inspector. I haven't figured out how to do this with Vulkan yet so for now choose GLES3X from the drop-down list.
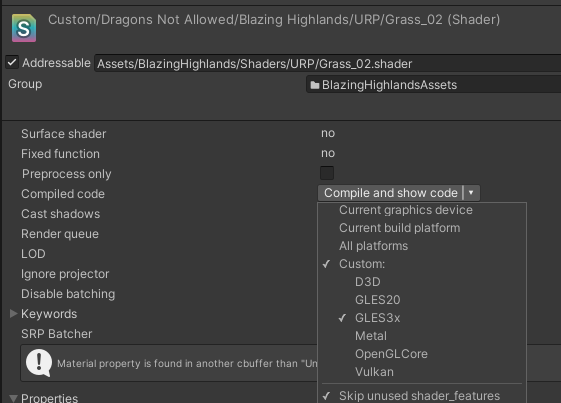
Now what this does is it will generate the shader code, and it should open in your default code editor. Save it wherever you want, preferably with a descriptive name or the same name.
Step 2: Installation
Fairly straightforward, head to this url : Arm Performance Studio
Mali Offline Compiler comes bundled with this, it's not available for download individually.
You might have to make an account to download it.
Step 3: Fixes errors, but inaccurate
The process works for one pass at a time, so this blog post will only deal with the forward pass since the process is pretty much the same for them all.
Go to the forward pass section and copy the vertex section of the code. It will start with "#version 300 es" as the first line, ending with the main function.
Save this in a file called shader.vert
MaliOC will automatically know its a vertex shader from its extension in the next coming steps.
Now this shader will not directly compile. we will need to make some changes to it.
First of all, look for this line :
UNITY_BINDING(0) uniform UnityPerDraw {and change it to this
uniform UnityPerDraw {Note: Removing this makes the outputs inaccurate, but good enough to make some quick decisions.
Next, we will copy the fragment section of the forward pass to another file called shader.frag and put it in the same folder as the vertex file we made earlier.
Sometimes there might be more such lines that might need removal, on trying to compile the cli will throw an error and will point to line number, just get rid of the UNITY_BINDING(x) part (x is a number).
Step 4: Compilation
Now what we will do is pick the GPU we want to compile it for. You can check the official documentation for the supported GPUs.
This has the list of all the supported GPUs. For this tutorial we will choose Mali-G76.
Compiling vertex shader
Open command line instance in that folder and run this command to give you stats on the vertex shader
malioc -c Mali-G76 shader.vertThis should give an output something like this:
Mali Offline Compiler v8.7.0 (Build cbd520)
Copyright (c) 2007-2025 Arm Limited. All rights reserved.
Configuration
=============
Hardware: Mali-G76 r0p0
Architecture: Bifrost
Driver: r51p0-00rel0
Shader type: OpenGL ES Vertex
Main shader
===========
Position variant
----------------
Work registers: 32 (100% used at 100% occupancy)
Uniform registers: 72 (56% used)
Stack use: false
16-bit arithmetic: 2%
A LS T Bound
Total instruction cycles: 1.46 3.00 0.50 LS
Shortest path cycles: 1.46 3.00 0.50 LS
Longest path cycles: 1.46 3.00 0.50 LS
A = Arithmetic, LS = Load/Store, T = Texture
Varying variant
---------------
Work registers: 30 (93% used at 100% occupancy)
Uniform registers: 62 (48% used)
Stack use: false
16-bit arithmetic: 1%
A LS T Bound
Total instruction cycles: 2.37 21.00 0.50 LS
Shortest path cycles: 2.37 21.00 0.50 LS
Longest path cycles: 2.37 21.00 0.50 LS
A = Arithmetic, LS = Load/Store, T = Texture
Shader properties
=================
Has uniform computation: true
Recommended attribute streams
=============================
Position attributes
- in_COLOR0 (location=dynamic)
- in_POSITION0 (location=dynamic)
- in_TEXCOORD0 (location=dynamic)
Non-position attributes
- in_NORMAL0 (location=dynamic)
- in_TANGENT0 (location=dynamic)
Compiling fragment shader
Run this command to get stats for the fragment shader
malioc -c Mali-G76 shader.fragIt should give an output like this:
Mali Offline Compiler v8.7.0 (Build cbd520)
Copyright (c) 2007-2025 Arm Limited. All rights reserved.
Configuration
=============
Hardware: Mali-G76 r0p0
Architecture: Bifrost
Driver: r51p0-00rel0
Shader type: OpenGL ES Fragment
Main shader
===========
Work registers: 30 (93% used at 100% occupancy)
Uniform registers: 46 (35% used)
Stack use: false
16-bit arithmetic: 25%
A LS V T Bound
Total instruction cycles: 3.03 0.00 1.75 0.50 A
Shortest path cycles: 3.03 0.00 1.75 0.50 A
Longest path cycles: 3.03 0.00 1.75 0.50 A
A = Arithmetic, LS = Load/Store, V = Varying, T = Texture
Shader properties
=================
Has uniform computation: true
Has side-effects: false
Modifies coverage: false
Uses late ZS test: false
Uses late ZS update: false
Reads color buffer: false
What you need to focus on is the tables and the memory stats in all these outputs.
If you want to export the data as is, in json format, that is also supported. Just add this line in the end of the command.
--format json -o file.jsonThe overall command will look something like this:
malioc -c Mali-G76 shader.vert --format json -o file.jsonThe json will be saved in the same location as shader.vert
Step 5: Benchmarking
The tables give a general idea about the computation time of the shader.
A (Arithmetic) → Time spent on math operations in the shader.
LS (Load/Store) → Time spent on memory reads and writes.
T (Texture) → Time spent on texture sampling operations.
V (Varying interpolation, fragment only) → Time spent interpolating data from the vertex stage.
The “Bound” column shows which category is the main performance limiter for that shader.
If you are wondering about the registers and stuff mentioned, you can checkout ARM's official documentation on it since I don't think I can do a better job explaining it. Link : https://developer.arm.com/documentation/101863/0803/Using-Mali-Offline-Compiler/Performance-analysis/Resource-usage
Note: Stats for T and LS may be slightly off due to the changes we made in Step 3, but A and V are usually still accurate
Since this blog is not about shader optimisation I'll directly get to the comparison. The console outputs you saw earlier is from an already optimised grass shader.
Fragment shader unoptimised:
Work registers: 31 (96% used at 100% occupancy)
Uniform registers: 100 (78% used)
Stack use: false
16-bit arithmetic: 8%
A | LS | V | T | Bound | |
Total instruction cycles: | 5.63 | 0 | 2.12 | 1 | A |
Shortest path cycles: | 5.63 | 0 | 2.12 | 1 | A |
Longest path cycles: | 5.63 | 0 | 2.12 | 1 | A |
Fragment shader optimised:
Work registers: 30 (93% used at 100% occupancy)
Uniform registers: 46 (35% used)
Stack use: false
16-bit arithmetic: 25%
A | LS | V | T | Bound | |
Total instruction cycles: | 3.03 | 0 | 1.75 | 0.5 | A |
Shortest path cycles: | 3.03 | 0 | 1.75 | 0.5 | A |
Longest path cycles: | 3.03 | 0 | 1.75 | 0.5 | A |
What this tells me is that
Total arithmetic workload is down by ~46%
Uniform register load down by 54%
Texture instructions is halved
Varying interpolation is trimmed by ~17%
Higher usage of 16-bit math - Over 3× more 16-bit ops - (faster ops)
The bound column tells you, which is taking the most gpu time, in my case it's the arithmetic, so optimisation tasks would begin in reducing that first and that's exactly what I did.
Since my scene had a lot of grass, the performance boost was noticeable. Average FPS went up by 12-15fps and it looks pretty much the same with all the features I needed from it.
Conclusion
Like I said earlier in this post (step 3), this is just a quick way to check shader performance in URP. It’s mainly to see if the changes I make are actually improving the shader or not, this is not a 100% accurate.
By quick I mean around 10 minutes max — any longer and I wouldn’t use this method. It doesn’t give super detailed results, but it does give me a clear enough picture to make fast decisions.
That’s all I need from it. Do what you want with this and let me know what you think in the comments.
Cheers.

Comments